Why Choose Our Data Visualization Services?

Use Cases for Our Data Visualization Services
Our data visualization services can be applied across various industries and functions:
- Executive Reporting: Transform data into clear insights with customized reports, pie charts, and visual summaries.
- Real-Time Analytics: Access interactive dashboards with live data, allowing teams to monitor key metrics and respond to trends.
- Predictive Insights: Utilize historical data to forecast trends, helping your business make proactive decisions.
- Cross-Departmental Collaboration: Provide each team with visuals tailored to their needs, enhancing data understanding and collaboration.
Frequently Asked Questions
1. What types of data can you visualize?
We work with a wide range of data sources, from CRM and ERP systems to external analytics platforms, structuring and visualizing data to meet your needs.
2. How can data visualization improve my business processes?
Our visualization techniques make it easy to identify patterns, optimize workflows, and make data-driven decisions, ultimately helping to enhance efficiency.
3. What tools do you use for creating dashboards?
We use industry-leading tools such as Power BI, Tableau, and custom solutions to build intuitive and interactive dashboards tailored to your business requirements.
Our Data Visualization Services
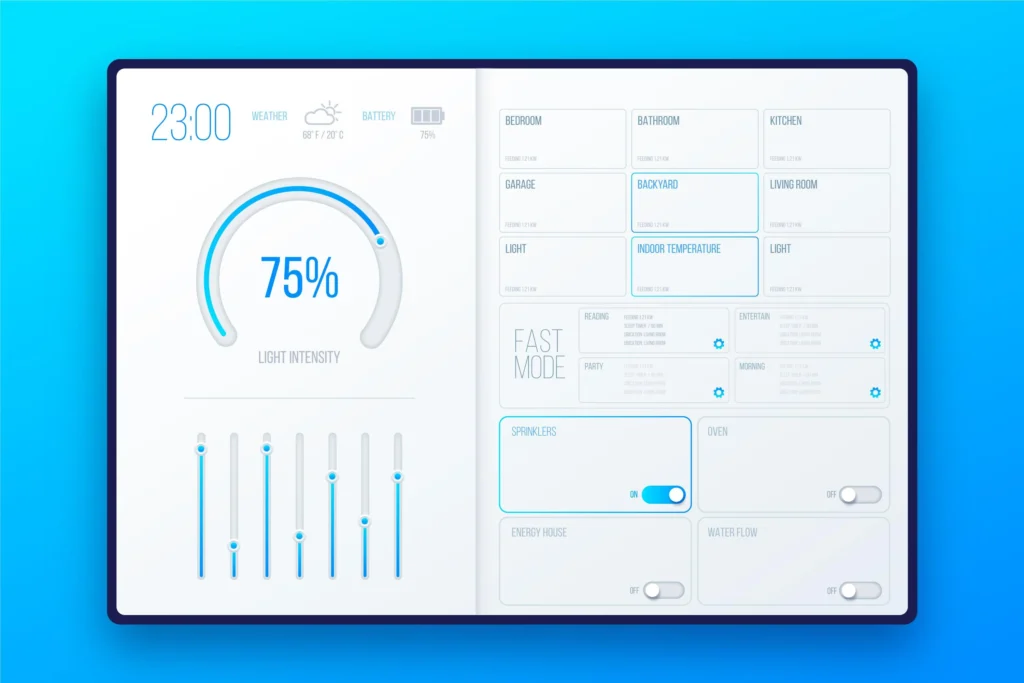
- Interactive Dashboards for Real-Time Analytics
Engage with data in real time. Our interactive dashboards provide an intuitive interface to explore metrics, trends, and data sources at a glance, supporting agile decision-making. - Custom Reports & Visuals
We create custom reports and visuals using various visualisation techniques, including pie charts, bar charts, and other formats that best communicate your data. Our visuals are designed to support data-driven strategies and clear insights. - Predictive Analytics & Insights
Combine data visualization with predictive analytics to gain future-oriented insights. Using structured data sources, we help forecast trends, empowering your team to anticipate changes. - Comprehensive Data Management & Transformation
Our data management services include structuring, cleaning, and integrating your data from multiple sources, ensuring that all visualizations accurately reflect the latest information.
Get Started with a Free Consultation
Ready to transform your data into actionable insights? Contact us to schedule a free consultation and discover how our data visualization solutions can enhance your business intelligence and help visualize success.
Contact Us Today: softinery.com/book-free-consultation
