Introduction
CSTR (Continuous Stirred-Tank Reactor) and PFR (Plug Flow Reactor) are crucial in the manufacturing industry. The choice of the right reactor type is important for the efficiency of a chemical process, as it impacts productivity, selectivity, and energy consumption. In this article, we will compare the performance of these two types of reactors using Softinery tools, which allow for chemical process simulations, including modeling of CSTR and PFR reactors.
Basic Differences Between CSTR and PFR
Before diving into performance comparisons, let’s recall the basic structural and operational differences between these two reactors:
- CSTR: A continuous stirred-tank reactor, where all reactants are fully mixed, resulting in uniform concentration throughout the tank. The flow of substances is continuous, and chemical reactions occur uniformly across the reactor’s volume.
- PFR: A plug flow reactor where reactants move through the reactor as a plug, with little mixing in the flow direction. Mixing occurs radially, meaning reactants change concentration along the reactor’s length.
Performance Simulation Using Softinery Tools
The Softinery platform offers the ability to simulate both reactor types, considering key process parameters such as:
- Inlet reactant concentration
- Kinetic constants
- Volumetric flow rate,
- Volume
- Reaction scheme (number of reactants, order, etc.)
Through the simulator, we can examine how variations in these parameters affect reactor performance under specific conditions.
First-order reaction
Let’s consider simple reaction:
![]()
For a first-order reaction, the reaction rate depends linearly on the concentration of reactant A, expressed as:
![]()
Where:
- rA is the reaction rate, mol A /m3s
- k is the rate constant, 1/s
- CA is the concentration of reactant A, mol A /m3
Let’s choose parameters of a process in the following way:
- Kinetic constant: k = 0.1 1/s
- Volume: V = 10 m3
- Volumetric flow rate: FV = 0.5 m3/s
- Inlet substrate concentration: 100 mol A/m3
Simulation of CSTR
We will use the simulator available under the address:
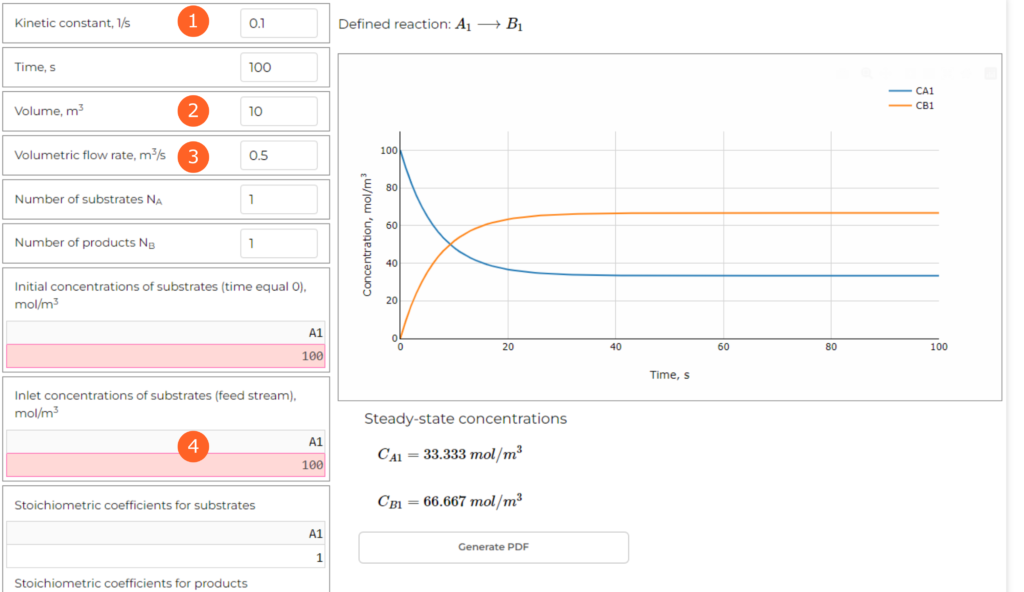
The user interface is presented in the figure below.

The parameters are introduced in the table on the left. Let’s define them as mentioned above (you need to open the web application and follow the steps):
- Step 1: Kinetic constant: k = 0.1 1/s
- Step 2: Volume: V = 10 m3
- Step 3: Volumetric flow rate: FV = 0.5 m3/s
- Step 4: Inlet substrate concentration: 100 mol A/m3
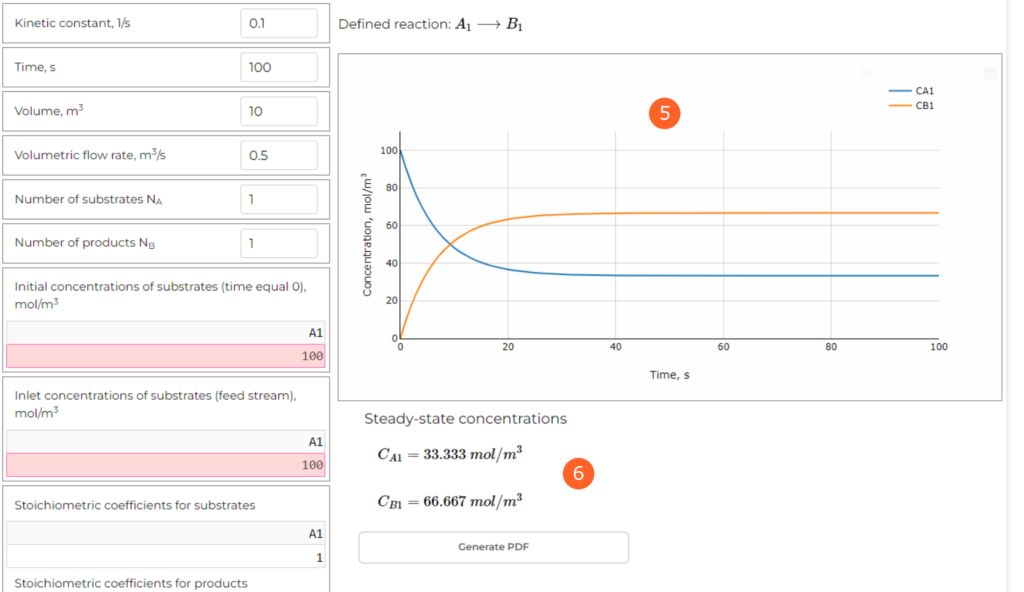
Other parameters can be used to define different reaction scheme and time of the simulation. As it’s a dynamic simulation, we should choose sufficiently large value to evaluate the behaviour. In this case 100 seconds is sufficient. From the diagram (point 5 in the Figure 2, below), we can see the changes of reactants concentrations with time. After about 40 seconds the process is stabilized, as the concentrations do not change any more.
The application also calculates steady-state concentrations (point 6 in the Figure 2). In this simulation we get:
CA = 33.33 mol/m3
CB = 66.67 mol/m3

Simulation of PFR
Calculating Flow Velocity in PFR
We will use the simulator available under the address:
The flow velocity of the fluid through a PFR is a key parameter that influences the residence time of reactants in the reactor, and thus, the efficiency of the reaction. The flow velocity (u) is calculated based on the volumetric flow rate (FV) and the cross-sectional area of the reactor (S). In our case, we assume that we know the total volume of the reactor and its length (L). Using this information, we can express the flow velocity as:
![]()
The length of the reactor (L) directly affects the flow velocity of the fluid through the reactor. In the case of a PFR, the longer the reactor, the more time the reactants spend inside it, which increases the reaction time and can improve chemical conversion. Assuming a length of 5 meters allows for a flow velocity of 0.25 m/s when combined with a volume of 10 m³ and a flow rate of 0.5 m³/s.
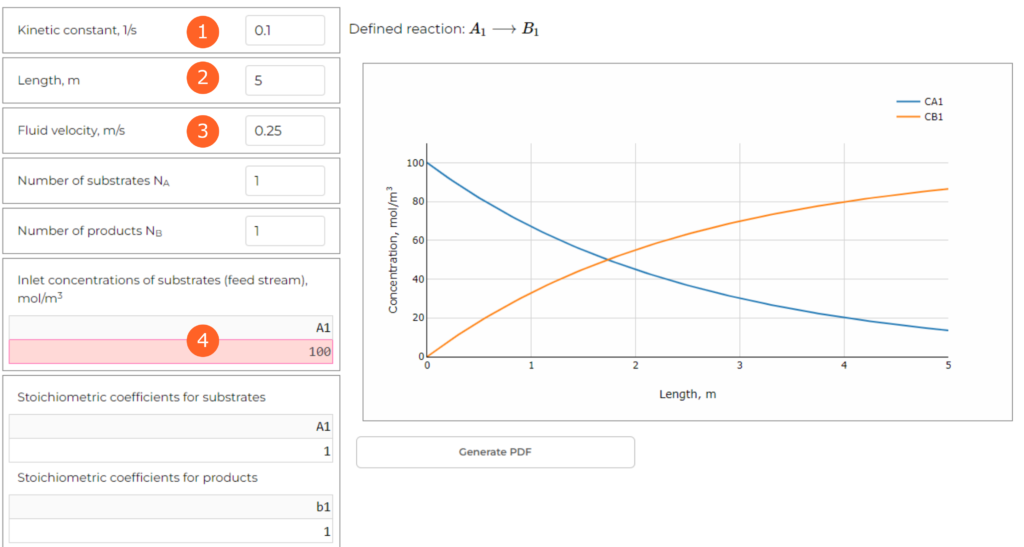
Now, we can introduce the parameters to the table in the interface of PFR (you need to open the web application and follow the steps):
- Step 1: Kinetic constant: k = 0.1 1/s
- Step 2: Length: L = 5 m
- Step 3: Fluid velocity: u = 0.25 m/s
- Step 4: Inlet substrate concentration: 100 mol A/m3

We are interested in the concentration at the end of the tube. In this scenario we get CA = 13.53 mol/m3.
Comparison of CSTR and PFR efficiency
For the same volumes of reactors, the outlet substrate concentration was significantly lower in PFR. In terms of conversion degree, the PFR efficiency is about 30% higher than CSTR as calculated below:
![]()
Why PFR Performs Better than CSTR
The performance difference between PFR (Plug Flow Reactor) and CSTR (Continuous Stirred-Tank Reactor) primarily stems from how the flow and concentration of reactants are managed in each reactor.
In a PFR, reactants flow through the reactor in a way that their concentration gradually decreases as the reaction progresses along the reactor’s length. At any given point in the PFR, reactants are at their highest concentration, which drives faster reaction rates. This concentration gradient allows the reaction to proceed more efficiently, especially for reactions where the rate depends on the concentration of the reactants, such as first-order reactions. The continuous flow of reactants along the reactor’s length ensures that higher conversion rates are achieved within a shorter residence time.
In a CSTR, the situation is different. The reactants are completely mixed within the reactor, resulting in a uniform concentration throughout the reactor volume, including at the exit. This uniformity means that reactants are present at a lower concentration on average, which slows down the reaction. The lower average concentration of reactants means that the reaction proceeds at a slower rate, resulting in lower conversion efficiency compared to a PFR for the same reactor volume and conditions.
Impact on Reaction Efficiency
In a PFR, the reaction efficiency is enhanced because the reactants are more available in the reactor for conversion, which leads to a higher rate of reaction. Conversely, in a CSTR, the uniform concentration lowers the overall driving force for the reaction, meaning it may take longer to reach the same level of conversion. For industrial applications where maximizing conversion is key, PFR tends to perform better under the same conditions due to the higher concentration gradients available throughout the reaction process.
In summary, PFR provides higher conversion rates because reactants are more concentrated at each point along the reactor, leading to faster reaction rates compared to the fully mixed environment of a CSTR, where the lower average concentration slows down the reaction.
Conclusions
Simulations conducted using the Softinery tool show that PFR achieves higher conversion than CSTR under the same conditions. The final choice between CSTR and PFR depends on the specific process requirements and the type of reaction. The Softinery tool allows for easy comparison of these two reactor types, providing support for engineers in making design decisions.

PhD. Eng. Dsc. Szymon Skoneczny has over a decade of experience in developing software for scientific and industrial purposes. He has worked for renowned companies, including Siemens, Electricite de France, and ArcelorMittal. His expertise also includes teaching and participating in research projects at institutions such as the AGH University of Science and Technology in Krakow and the Cracow University of Technology. He is the author of over 40 scientific publications on computer simulations of bioreactors, which have been published in esteemed international journals. Moreover, he has collaborated on research projects funded by the European Union, focusing on the use of high-performance computing.
