Batch bioreactor – definition
Batch bioreactors are stirred vessels in which a biological process takes place. These devices can be designed to facilitate the growth of microbial cells, for the degradation of toxic compounds, or for the production of valuable products (Singh et al. 2020, Moo-Young 2019). They are widely used in industry because of easy operation and low risk for contamination (Kosseva and Webb. 2020). In a batch fermentation, all nutrients are supplied at the initial time. After inoculation, the process runs until desired product concentration is achieved (Moo-Young 2019).

Mathematical model of a batch bioreactor
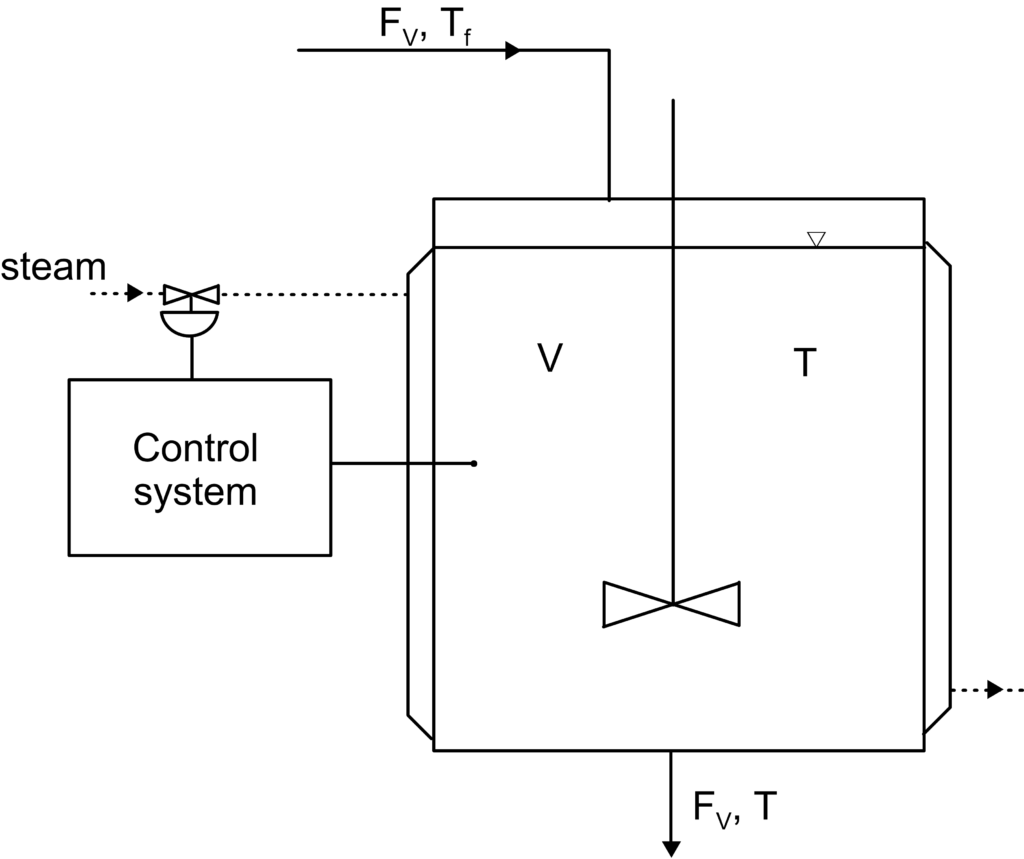
A batch bioreactor is a tank with an agitator, which makes the environment inside well mixed. Typically, researchers assume perfect mixing, which means that concentrations of nutrients and biomass are the same in the whole volume of the liquid. We can write the mathematical model of such a system as follows:
![\[\frac{dX}{dt}=\mu (X,S)\cdot X-k_{d}X\]](https://softinery.com/wp-content/ql-cache/quicklatex.com-60c6e732de89624cc1aafad37ebb39d9_l3.png "Rendered by QuickLaTeX.com")
![\[\frac{dS}{dt}=-\frac{1}{Y_{XS}}\cdot \mu (X,S)\cdot X\]](https://softinery.com/wp-content/ql-cache/quicklatex.com-008ffca54ef88b656030679e10ad6513_l3.png "Rendered by QuickLaTeX.com")
where:
S – substrate (nutrient) concentration, kg/m3
X – biomass (microorganisms) concentration, kg/m3
kd – decay(death) rate of bacteria, 1/h
t – time, h
V – volume, m3
YXS – biomass growth yield, kg B/kg A
μ – specific growth rate, 1/h
To solve the system of differential equations we also need to know the initial conditions. In the problem discussed, we use the bacteria concentration and substrate concentrations at time equal zero:
![\[X(0)=X_0\]](https://softinery.com/wp-content/ql-cache/quicklatex.com-506610365baf0e683061d40a6896935a_l3.png "Rendered by QuickLaTeX.com")
![\[S(0)=S_0\]](https://softinery.com/wp-content/ql-cache/quicklatex.com-e8257181ae6c63d74de7bd869e65913b_l3.png "Rendered by QuickLaTeX.com")
We should note that it is a single-substrate model. It means that only one nutrient is limiting the cell growth, while other ones are in sufficiently large amounts. This condition is not always met. For example, in aerobic processes it may be necessary to take into account oxygen concentration influence on the cell growth. We can find double-substrate kinetic models, like the one describing aerobic biodegradation of phenol by Pseudomnas putida (Tang et al. 1987).
The coefficient YXS (growth yield coefficient) denotes the amount of biomass produced on a given amount of substrate (nutrient).
Specific growth rate μ function depends on the process. One of the most common equations is the Monod model:
![\[\mu =\mu_{max}\frac{S}{S+K_{S}}\]](https://softinery.com/wp-content/ql-cache/quicklatex.com-054801ed4e7291b01c9b32896468a11c_l3.png "Rendered by QuickLaTeX.com")
where:
μ max – maximum specific growth rate, 1/h
KS – half saturation constant, kg/m3
Monod kinetic model is common for microbiological processes without substrate or product inhibition. You can find more about this model on ScienceDirect.
Simulation of a batch bioreactor
Every microbiological process is characterized by biokinetic parameters, which are determined based on experimental data. For the numerical simulation, we will use values obtained for a process of toluene biodegradation by P. putida (Lin and Cheng, 2007):
μ max = 0.86 1/h
KS = 0.0138 kg/m3
YXS = 1.28 kg B/kg A
In this particular study, the authors did not obtain the decay rate coefficient, therefore we will use a value from the study by Laspidou et al. (2002):
kd = 3.3×10⁻³ 1/h
Implementation in Python
We will use Python for solving the model. First, let’s import necessary libraries. Numpy for matrix operations, scipy for solving a system of differential equations, and matplotlib for plotting a diagram.
import numpy as np
from scipy.integrate import odeint
import matplotlib.pyplot as plt
In the next step we will define the system of differential equations. It is a function with two arguments: y and t. Vector y consists of state variables, that is X and S. The function returns dydt, which is a list with two values calculated according to the right-hand-sides of the system.
# Define the ODE system
def ode_func(y, t):
    # y: array of dependent variables
    # t: independent variable (time)
    # Define the ODEs here
    X = y[0]
    S = y[1]
    mu_max = 0.86
    Ks = 0.0138
    Y_XS = 1.28
    kd = 3.3e-3
    mu = mu_max * S / (S + Ks)
    dydt = [mu * X - kd, -1/Y_XS * mu * X]
    return dydt
Now, let’s define the initial condition, y0. The first value in this vector is the initial biomass concentration, and the second is the substrate concentration. We will use the odeint function from scipy to solve the system.
# Set initial conditions
y0 = [0.005, 0.07]

# Set the time grid
t = np.linspace(0, 15, 100)

# Solve the ODE system
sol = odeint(ode_func, y0, t)
In the final step we will plot a diagram using matplotlib.
# Extract the solution variables for plotting
X = sol[:, 0] # extract the first variable
S = sol[:, 1] # extract the second variable
# Plot the solution
plt.plot(t, X, label='X')
plt.plot(t, S, label='S')
plt.xlabel('Time, h')
plt.ylabel('Concentration, kg/ ')
plt.legend()
plt.grid(True)
plt.show()
')
plt.legend()
plt.grid(True)
plt.show()
We can see that at the beginning of the process, the cell concentration increases and the toluene concentration decreases. It is related to the life processes of microbial cells, which use the nutrient for multiplication. After about 9 hours, there is no toluene in the tank, and as a result, the concentration of bacteria starts to fall. This is the process of bacteria’s death (or decay). The simulation shows how much time is necessary to utilize the whole toxic compound. For this scenario, it is about 9 hours.
Summary
A batch bioreactor is one of the simplest types of bioreactors but is often used in the food industry (for example, in ethanol production), in wastewater treatment, and for cell culture.
Simulations are fundamental in chemical and biochemical engineering, also in bioreactor design. They can be used for calculating proper vessel size, finding adequate operating conditions, and scaling up the process. Bioreactor simulations can also be used to calculate the time required to obtain the desired biomass or product concentration.
You can learn more about Python for science from our courses
Related topics
PID controller in Python
Lecture notes in process control

Plug-flow reactor simulation
References
Kosseva, Maria, and Colin Webb, eds. Food industry wastes: assessment and recuperation of commodities. Academic Press, 2020.
Laspidou, Chrysi S., and Bruce E. Rittmann. “Non-steady state modeling of extracellular polymeric substances, soluble microbial products, and active and inert biomass.” Water Research 36.8, 2002.
Lin, Chi‐Wen, and Ya‐Wen Cheng. “Biodegradation kinetics of benzene, methyl tert‐butyl ether, and toluene as a substrate under various substrate concentrations.” Journal of Chemical Technology & Biotechnology: International Research in Process, Environmental & Clean Technology 82.1, 2007.
Moo-Young, Murray. Comprehensive biotechnology. Elsevier, 2019.
Singh, Nitin Kumar, et al. “Bioreactor and bioprocess technology for bioremediation of domestic and municipal wastewater.” Bioremediation of Pollutants. Elsevier, 2020.
Tang, W-T., K. Wisecarver, and Liang-Shih Fan. “Dynamics of a draft tube gas—liquid—solid fluidized bed bioreactor for phenol degradation.” Chemical engineering science 42.9 (1987): 2123-2134.